
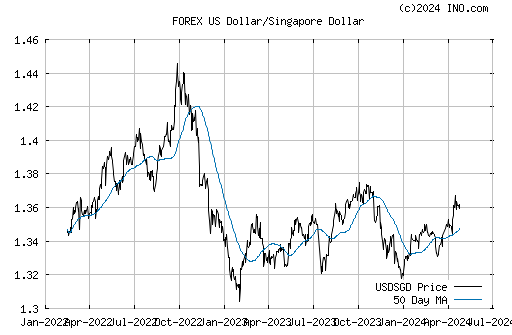
Singapore Dollar vs. US Dollar showing projected peak in July 2008.
As can be seen in the chart below, the forecast from the winter of 2007-2008 for the peak in the Singapore Dollar Vs. the USA in July 2008 was exactly correct.
Stock and Commodity Market Timing
 Digits.net


Your analysis is very intringing and correct. I would like to understand your analysis.
ReplyDeleteWhy do you have more analysis?
Can you be contacted by e-mail?
Regards,
Richard
Your analysis is very intriguing and correct. I would like to understand your analysis.
ReplyDeleteWhy don't you post more comments?
Can you be contacted by e-mail?
Regards,
Richard
Richard:
ReplyDeleteWell, the site is just a hobby at this time, I have had dozens of hits on market turns over the past decade using this oscillator.
I may post some more projections in the near future. I think this market sell-off will likely go down into mid 2011, in line with Martin Armstrong's pi cycle, I have some long term projections in agreement with the 8.6 year pi cycle.
At this time I am just communicating through this site.
Russ
Thank you for your fast answer!
ReplyDeleteHow does your oscillator work? How can I understand it?
The Pi Cycle have been correct.
Don't heistate to post more projections.
Regards,
Richard
Hi, Russ. I wonder if you could update the singapore dollar chart. TIA.
ReplyDeleteAl